FAIR VALUE REPORT
AGNC INVESTMENT · AGNC · OCT 20, 2026 · AFTER RESULTS OF OCT 19, 2026
Is AGNC worth $13.83 when its own balance sheet says $7.13?
The model sees 64% upside; two banks now see a stock worth less than today's $8.44. In between sits a 17% dividend covered by one cent a quarter.

FPI VERDICT · OCT 20, 2026
DCF 50% · RELATIVE 30% · CONSENSUS 20%
63.9%
below fair value
UNCERTAINTY
LOW ±10%
FAIR VALUE BAND
$12.45 – $15.21
PRICE VS BAND
BELOW THE BAND
Numbers as of publication. Today's fair value and price: AGNC stock page → · How uncertainty is rated →
5 MIN READ
THE REPORT IN 3 POINTS
- 01AGNC's tangible book value fell 16.9% to $7.13 per share in the quarter to September 2026, a $1.45 drop.
- 02Net spread income of $0.37 per share covers the $0.36 quarterly dividend by just one cent, after $0.40 and $0.42.
- 03JPMorgan cut its target to $8 and BofA to $8.50 on 16 October 2026, versus the FPI model's $13.83.
$1.45 of book value gone in 92 days - and the hedges caught only two-thirds
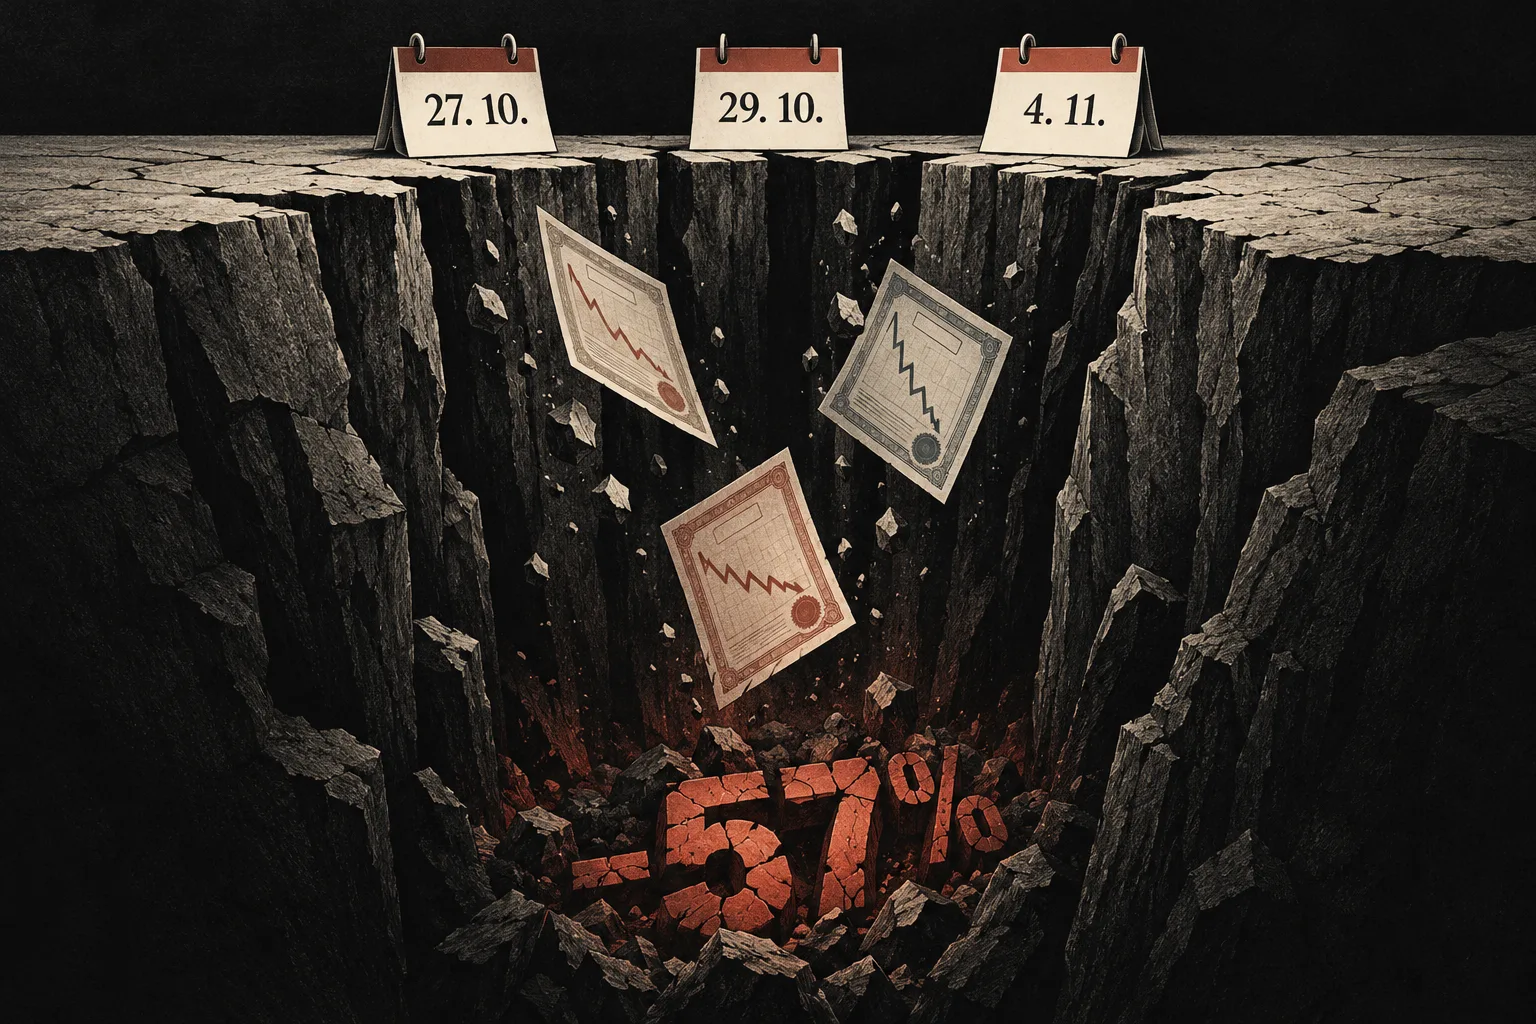
AGNC Investment ($AGNC) owns about $94 billion of government-guaranteed mortgage bonds financed with roughly $86 billion of short-term borrowing, so the stock is worth, in the end, what that bond pile is worth after debt. In the quarter to September 2026 that number, tangible net book value per share, fell to $7.13 from $8.58, a drop of $1.45 or 16.9% in 92 days. The comprehensive loss was $1.28 per share and the economic return, dividends plus the change in book, was -12.7% for the quarter, not annualised.
The bond portfolio lost $5.0 billion of market value; the hedges, interest rate swaps and short Treasury positions, gained $3.3 billion. Two-thirds of the damage was covered, one-third was not. The 10-year Treasury yield touched 5.342% on 1 October 2026, a 24-year high, and the mortgage bonds AGNC holds did worse than Treasuries: in September 2026 alone they lagged by 0.96 percentage points, the weakest month since March 2023.
Management's response was to lift the hedge ratio to 90% of funding from 73% and let leverage drift to 7.9x tangible equity from 7.4x. That is a bigger cushion against rates going higher and a thinner one against anything else. Unencumbered cash and bonds stood at $6.3 billion, 57% of tangible equity.
| REPORTED | REVENUE | VS EST. | EPS | VS EST. | PRICE REACTION |
|---|---|---|---|---|---|
| OCT 19, 2026 | $1.2B | +13.2% | $0.37 | 0.0% | – |
| JUL 20, 2026 | $1.0B | −3.9% | $0.40 | +5.3% | −1.3% |
| APR 20, 2026 | $1.1B | +6.2% | $0.42 | +16.7% | +1.3% |
| JAN 26, 2026 | $944M | +0.3% | $0.35 | −5.4% | +3.1% |
| OCT 20, 2025 | $903M | +154.5% | $0.35 | −7.9% | −0.5% |
| JUL 21, 2025 | $-112M | −127.9% | $0.38 | −9.5% | +1.5% |
| APR 21, 2025 | $-418M | −191.8% | $0.44 | +7.3% | +1.3% |
| JAN 27, 2025 | $154M | −35.4% | $0.37 | −11.9% | +2.0% |
AGNC Investment beat the EPS estimate in 3 of the last 8 quarters. Price reaction is the move on the trading day after the results.
The $0.12 monthly dividend is covered by exactly one cent
AGNC pays $0.12 a month, $0.36 a quarter, $1.44 a year. The money comes from net spread and dollar roll income, the gap between what the bonds yield and what the borrowing costs after hedges. That came in at $0.37 per share in the quarter to September 2026, after $0.40 in the quarter to June and $0.42 in the quarter to March. Two quarters down in a row, and the cushion over the payout is now one cent.
The funding side is doing the damage. The annualised net interest spread slipped to 1.86% from 2.00% and 2.06% in the two prior quarters. Swap income that subsidises borrowing was $153 million, down from $245 million in the quarter to September 2025, because older swaps that paid AGNC fixed rates far below today's levels are rolling off.
The dividend is also now large relative to what is left: $1.44 a year on a $7.13 book is 20.2% of equity. AGNC sold 97.6 million new shares for $992 million, about $10.16 each, during the quarter, above book at the time; the share count is up 17.6% in twelve months to 1,261.8 million. The last time book fell this fast, AGNC cut the monthly dividend to $0.12 from $0.16 on 8 April 2020. The payout has not changed since.
Why the model says $13.83 - 1.94 times a book value that just shrank
The FPI fair value is $13.83, and at $8.44 the stock trades 63.9% below it. The gap comes from how a cash-flow lens sees AGNC. The stock trades at 4.5x trailing earnings against an industry median of 10.9x; its free cash flow yield (cash generated per dollar of share price) is 8.86% against 7.44% for peers; return on equity is 18.3% against 8.2%; net margin is 72% against 19.7%. Those inputs pull a discounted cash flow and a peer comparison upward.
The weakness of that lens is that for a leveraged bond fund the book is the anchor and the earnings multiple is the sail. Mortgage REITs are usually priced close to what their assets are worth after debt; at $8.44 AGNC already sits at 1.18x a $7.13 book, an 18% premium. $13.83 would be 1.94x book. The last time the stock was near that, $15.04 at the end of 2021, it then fell 62.9% to October 2023 as rates rose. The FPI cautions point the same way: interest coverage of 1.29x, revenue down 16.7% over three years, return on invested capital of 3.4%. The trailing earnings feeding the multiple were earned with a 2.06% spread; the spread now is 1.86%.
Over the 120 days to October 20, 2026 the share price went from $10.38 to $8.44 (−18.7%) and the FPI fair value from $13.83 to $13.83 (0.0%). The gap moved from 33.2% below fair value to 63.9% below.
Street vs model: JPMorgan $8, BofA $8.50, FPI $13.83
The consensus is hold, with 11 buy, 21 hold and 3 sell ratings. FPI's target data as of 9 October 2026 showed a low of $11, a median of $12 and a mean of $11.67, so the model sits 18.5% above the Street's mean.
Since then the Street has moved first, and down. Piper Sandler cut to $10 from $12 on 9 October 2026, then JPMorgan to $8 from $11 and BofA to $8.50 from $10.50 on 16 October 2026, both below the $8.44 price and issued three days before the results. Against the model, the gaps are 73% and 63%.
The most likely explanation is a difference of method. Banks price mortgage REITs off book value, typically 1.0-1.2x, and marked the book down as Treasury yields rose; $8 is 1.12x the new $7.13. The DCF and peer legs of a blended model are fed by trailing cash flows, which have not shrunk yet. Insiders are on the Street's side: 19 sales worth $14.2 million in twelve months, zero purchases, including the CFO selling at $10.79-$11.10 between 12 May and 19 August 2026.
11 buy · 21 hold · 3 sell. FPI fair value sits 15% above the highest Street target, the share price is below the whole range.
Three numbers for the next quarter: $0.36, $7.13 and 5% on the 10-year
For the stock to re-rate towards the model, the bond pile has to recover. That needs the 10-year yield back below 5% and mortgage spreads to narrow from about 1.25 percentage points over Treasuries; at 7.9x leverage every narrowing adds to book the same way widening took $1.45 away. The price would also have to reclaim the $9.96 50-day average and then the $10.60 200-day average before the market treats the quarter as a one-off.
For a further de-rating, net spread income has to print below $0.36 on 25 January 2027 (consensus EPS $0.38), or book has to fall from $7.13 again. Either puts a 2020-style dividend cut on the table, and the 17% yield that holds the share price up goes with it.
Three signals to watch:
- net spread and dollar roll income against the $0.36 quarterly dividend
- tangible book against $7.13, and the price against 1.0x book as the level where the premium is gone
- the 10-year Treasury against 5%, with the $8.39 52-week low and an RSI(14) of 27 as the technical floor
TOP OF THE FPI FAIR VALUE BAND
- 01A 10-year Treasury back below 5% from the 5.342% hit on 1 October 2026 would lift the $94 billion bond pile and rebuild tangible book from $7.13.
- 02At 7.9x leverage, mortgage spreads narrowing from about 1.25 points over Treasuries adds to book as fast as widening took $1.45 away in 92 days.
- 03Cash-flow metrics support the upside case: 4.5x trailing earnings against a 10.9x industry median, 18.3% ROE versus 8.2%, and an 8.86% free cash flow yield.
LOWEST WALL STREET TARGET
- 01Net spread and dollar roll income fell to $0.37 for the quarter to September 2026 from $0.40 and $0.42, leaving one cent of cover over the $0.36 dividend.
- 02JPMorgan cut to $8 and BofA to $8.50 on 16 October 2026, both below the $8.44 price, pricing the stock near 1.1x the new $7.13 book.
- 03Insiders sold 19 times for $14.2 million over twelve months with zero purchases, including the CFO at $10.79-$11.10 between 12 May and 19 August 2026.
FPI FAIR VALUE $13.83 · FPI fair value of $13.83 sits far above the $11.00 low Street target and just under the $15.21 band top, a gap that rests on trailing cash flows earned at a 2.06% spread now down to 1.86%.
FPI fair value blends a discounted cash flow model (50%), relative valuation against sector peers (30%) and analyst consensus (20%), updated daily. How the model works →
TRACK THE NUMBER
Get notified when AGNC's fair value changes
Set your own buy price for AGNC and the app alerts you when the stock reaches it. iOS and Android.


MORE AGNC REPORTS
This is the first FPI fair value report on AGNC Investment. The next one follows the company's next quarterly results.
MORE REPORTS IN REAL ESTATE
- VICI · Who is right about VICI: the $2 billion buyback or the $458 million loss reserve?OCT 30, 2026
- WPC · W. P. Carey's dividend now beats Treasuries by one point. Is that enough to own it?OCT 28, 2026
- NLY · Annaly hedged 100% and still lost 11% of its book. What does the 16% yield pay for?OCT 21, 2026
Fair Price Index is for informational purposes only and does not constitute investment advice. Fair value calculations are model-based estimates and may not reflect actual market conditions. Always conduct your own research before making investment decisions.